Tagging points and regions
The DataArrays store data, but this is not all that is needed to store scientific data. We may want to highlight points or regions in the data and link it to further information.
This is done using the Tag and the MultiTag, for tagging single or mutliple points or regions, respectively.
The basic idea is that the Tag defines the point (and extent) with which it refers to points (or regions) in the data. A tag can point to several DataArrays at once. These are mere links that are stored in the list of references. The following figure illustrates, how a MultiTag links two DataArrays to create a new construct.
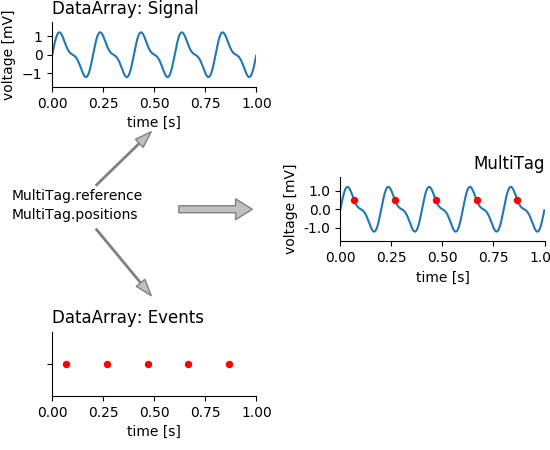
mtag_concept_plot
Single points/regions
Tagging in 1D
Suppose, we are recording the response of a system to a certain stimulus.
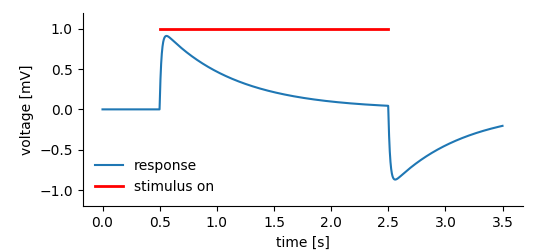
simple_tag_plot
We may want to store:
The recorded system’s response before, during, and after the stimulus.
The time, the stimulus was on.
In the NIX data model Tag entities are used to tag regions in a DataArray. For this, the Tag refers to the DataArray and stores position and extent of the highlighted segment.
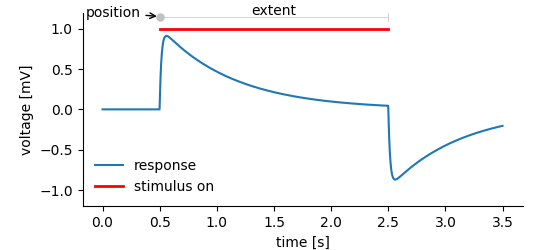
simple_tag_plot
#include <nix.hpp>
#include <numeric>

int main() {
    double interval = 0.01;
    double stim_on = 0.5;
    double stim_off = 2.5;
    std::vector<double> response(350);
    std::iota(response.begin(), response.end(), 0.);
    std::transform(response.begin(), response.end(), response.begin(),
                   [interval](double x){ return x * interval; });
    std::transform(response.begin(), response.end(), response.begin(),
                   [stim_on, stim_off](double x){ return (x >= stim_on && x < stim_off) ? 1 : 0; });

    nix::File f = nix::File::open("tagging1.nix", nix::FileMode::Overwrite);
    nix::Block block = f.createBlock("demo block", "nix.demo");

    nix::DataArray data = block.createDataArray("response", "nix.sampled", response);
    data.label("voltage");
    data.unit("mV");

    nix::SampledDimension dim = data.appendSampledDimension(interval);
    dim.label("time");
    dim.unit("s");

    nix::Tag stim_tag = block.createTag("stimulus", "nix.stimulus_segment", {stim_on});
    stim_tag.extent({stim_off - stim_on});
    stim_tag.addReference(data);

    f.close();
    return 0;
}
Note! Position and extent of the tagged region are given as
std::vector. Extent is optional, not setting it tags a point instead
of a segment of the referenced data.
Handling of units
In the above example we do not explicitly specify a unit for position and extent. They are implicitly assumed to be given in the same unit as the DataArray. It is, however, possible to specify a unit (or rather a unit for each dimension), if this is more convenient. For example, it would be possible to give position and extent in ms. In this case, NIX does not validate. It is the user’s responsibility that units match. In order to work smoothly, it is best to use only SI units and compounds of these.
nix::Tag stim_tag = block.createTag("stimulus", "nix.stimulus_segment", {stim_on});
stim_tag.extent({stim_off - stim_on});
stim_tag.units({"ms"});
Tagging in 2D
The same principle shown above for 1-D data extends to two or more dimensions. The only difference is that one has to provide vectors of positions/extents whose length matches the number of dimensions of the referenced DataArray.
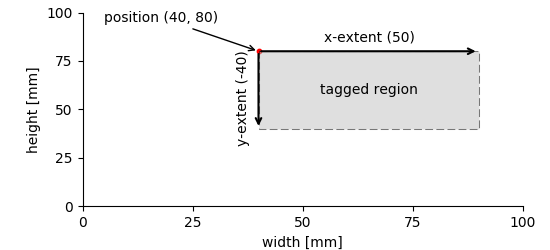
2d_tag_plot
#include <nix.hpp>
#include <nix/hydra/multiArray.hpp>

int main() {
    // create 2D dummy data
    typedef boost::multi_array<double, 2> array_type;
    typedef array_type::index index;
    array_type data(boost::extents[100][100]);

    int values = 0;
    for(index i = 0; i < 100; ++i)
        for(index j = 0; j < 100; ++j)
            data[i][j] = values++;

    // create a new file, enable compression
    nix::File f = nix::File::open("2_d_tag.nix", nix::FileMode::Overwrite, "hdf5", nix::Compression::DeflateNormal);
    nix::Block b = f.createBlock("demo block", "nix.demo");

    nix::DataArray array = b.createDataArray("2D data", "nix.sampled.2d", data);
    array.label("fantastic ints")
    // add descriptor for x-, and y axes
    SampledDimension dim = array.appendSampledDimension(1.);
    dim.label("width");
    dim.unit("mm");

    dim = array.appendSampledDimension(1.);
    dim.label("height");
    dim.unit("mm");

    nix::Tag tag = b.createTag("tagged region", "nix.region", {40., 80.});
    tag.extent({50., -40.});
    tag.addReference(array);
    return 0;
}
Multiple points/regions
Tagging multiple points in 1D
Consider the following situation: A signal has been recorded and within this signal, certain events have been detected (figure below).
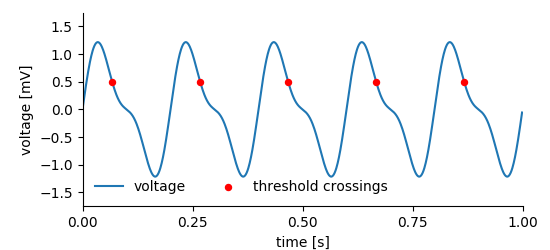
multiple_points_plot
For storing this kind of data we need two DataArrays, the first stores the recorded signal, the other the events. Finally, a MultiTag entity is used to link both. One can use the event times stored in one of the DataArrays to tag multiple points in the signal.
#include <nix.hpp>
#include <numeric>

int main() {
    // create dummy data
    std::vector<double> time(1000);
    std::vector<double> voltage;
    std::vector<double> threshold_crossings;
    double threshold = 0.5;
    double interval = 0.001;
    double pi = 3.1415;
    double freq = 5.;

    std::iota(time.begin(), time.end(), 0.);
    std::transform(time.begin(), time.end(), time.begin(),
                   [interval](double t){ return t * interval; });
    std::transform(time.begin(), time.end(), std::back_inserter(voltage),
                   [pi, freq](double t){ return std::sin(t * freq * 2 * pi) + std::sin(t * freq * 4 * pi) * 0.4; });
    for (size_t i = 0; i < voltage.size() - 1; ++i) {
        if (voltage[i] <= threshold && voltage[i+1] > threshold) {
            threshold_crossings.push_back(time[i]);
        }
    }

    // open a file, create a block that will host the data
    nix::File f = nix::File::open("mtag_test.nix", nix::FileMode::Overwrite, "hdf5",
                                  nix::Compression::DeflateNormal);
    nix::Block b = f.createBlock("demo block", "demo");

    // create two DataArrays, one for the signal, the other one for the events
    nix::DataArray signal = b.createDataArray("signal", "nix.sampled", voltage);
    signal.label("voltage");
    signal.unit("mV");

    nix::SampledDimension dim = signal.appendSampledDimension(interval);
    dim.label("time");
    dim.unit("s");

    nix::DataArray events = b.createDataArray("threshold crossings", "nix.event_times", threshold_crossings);
    events.label("time");
    events.unit("s");

    events.appendAliasRangeDimension();

    // create the MultiTag entity to link signal and events
    nix::MultiTag mtag = b.createMultiTag("event tag", "nix.event_tag", events);
    mtag.addReference(signal);

    f.close();
    return 0;
}
Creating the MultiTag is very similar to the creation of the simpler Tag above. The main difference is that the tagged positions are not stored in the MultiTag itself but we use the event DataArray (events in the code example) for this purpose. Finally, the signal DataArray is added to the list of references.
Tagging multiple intervals in 1D
In the following exampled we want to plot multiple intervals in which, for example, a stimulus was switched on.
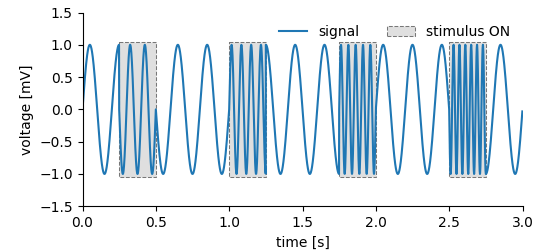
multiple_regions_plot
For storing such data we again need one DataArray to store the recorded signal. Storing the regions is similar to the approach for the simpler Tag, i.e. positions and the extents need to be provided. Accordingly, two additional DataArrays are required. The first of which stores the positions and the second the extents.
#include <nix.hpp>
#include <numeric>

int main() {
    // create dummy data, i.e. stimulus and response
    double interval = 0.001;
    double stim_duration = 0.25;
    double baseline_freq = 5.;
    double pi = 3.1415;
    std::vector<double> time(3000);
    std::vector<double> stimulus(3000, 1.);
    std::vector<double> response;

    std::iota(time.begin(), time.end(), 0.);
    std::transform(time.begin(), time.end(), time.begin(),
                   [interval](double t){ return t * interval; });

    std::vector<double> stim_on_times(4);
    for (size_t i = 0; i < stim_on_times.size(); ++i)
        stim_on_times[i] = i * stim_duration * 3 + 0.25;

    for (size_t i = 0; i < stim_on_times.size(); ++i) {
        for (size_t j = 0; j < time.size(); ++j) {
            if (time[j] >= stim_on_times[i] + stim_duration)
                break;
            if (time[j] >= stim_on_times[i])
                stimulus[j] = i + 2;
        }
    }

    for (size_t i = 0; i < time.size(); ++i) {
        response.push_back(std::sin(time[i] * 2 * pi * stimulus[i] * baseline_freq));
    }

    // store the data in NIX
    nix::File f = nix::File::open("multiple_regions.nix", nix::FileMode::Overwrite,
                                  "hdf5", nix::Compression::DeflateNormal);
    nix::Block b = f.createBlock("demo block", "nix.demo");

    // store the response in a DataArray
    nix::DataArray array = b.createDataArray("signal", "nix.sampled", response);
    array.label("voltage");
    array.unit("mV");

    SampledDimension dim = array.appendSampledDimension(interval);
    dim.label("time");
    dim.unit("s");

    // create DataArrays to store stimulus onset positions and durations
    nix::DataArray positions = b.createDataArray("stimulus ON", "nix.event_times", stim_on_times);
    positions.label("time");
    positions.unit("s");
    positions.appendAliasRangeDimension();

    std::vector<double> ext(stim_on_times.size(), stim_duration);
    nix::DataArray extents = b.createDataArray("stimulus extents", "nix.extents", ext);
    extents.label("time");
    extents.unit("s");
    extents.appendSetDimension();

    // create the MultiTag
    nix::MultiTag mtag = b.createMultiTag("stimulus regions", "nix.region", positions);
    mtag.extents(extents);
    mtag.addReference(array);

    f.close();
    return 0;
}
The example code is rather straight forward. The DataArrays ‘positions’ and ‘extents’ take respective data and are added to the created MultiTag entity. Finally, the array storing the data is added to the list of references of the MultiTag.
Adding features
We use the above example to increase complexity a bit. So far, the MultiTag ‘mtag’ just notes that in the data stored in ‘array’ there are some interesting intervals in which something happened. The name of the MultiTag entity tells us that the highlighted intervals represent stimulus regions. Using Features we can now add further information to these regions. Let’s assume we wanted to store the stimulus intensity. The following lines of code can be inserted into the previous example before the file is closed.
// extract stimulus intensities from the stimulus vector
std::vector<double> stimulus_intensities;
for (double stim_on_time : stim_on_times) {
    stimulus_intensities.push_back(stimulus[size_t(stim_on_time / interval) + 1]);
}

nix::DataArray stimulus_intensities = b.createDataArray("stimulus intensities", "nix.collection", stimulus_intensities);
stimulus_intensities.label("voltage");
stimulus_intensities.unit("V");
stimulus_intensities.appendSetDimensions();

mtag.createFeature(stimulus_intensities, nix::LinkType::Indexed);
The Feature adds the information stored in a DataArray to the Tag/MultiTag. The way this information has to be interpreted is specified via the LinkType. There are three distinct types:
Indexed: For each position in the referring Tag/MultiTag there is one entry in the linked DataArray. In case the linked DataArray is multi-dimensional, the number of entries along dimension 0 must match the number of positions.
Tagged: Positions and extents of the referring Tag/MultiTag need to be applied in the same way to the linked DataArray as to the referenced data (stored in the ‘references’ list).
Untagged: The whole data stored in the linked Feature is a feature of the Tag/MultiTag ignoring any indexing, positions or extents.
In the above example we have a single stimulus intensity for each position. Hence, the LinkType::Indexed is used.
Tagging in n-D
The same principle as demonstrated above applies also to n-dimensional data. Tagging in n dimensions requires positions and extents stored in DataArrays of appropriate shapes.
The following figures show the tagging of multiple regions in 2- and 3D.
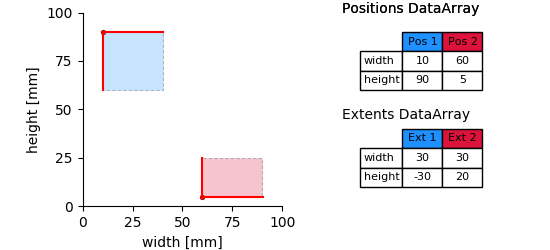
multiple_regions_2D_plot
According to the number of dimensions of the data (here, width and height) each starting point and the extent of a tagged region is defined by two numbers. Thus, the position and extent DataArrays are two dimensional. The first dimension represents the number of tagged regions, the second the number of dimensions.
#include <nix.hpp>
#include <nix/hydra/multiArray.hpp>

int main() {
    typedef boost::multi_array<int, 2> array_type_2d;
    typedef array_type_2d::index index;

    array_type_2d data(boost::extents[100][100]);
    for(index i = 0; i < 100; ++i) {
        for(index j = 0; j < 100; ++j) {
            data[i][j] = std::rand() % 100 + 1;
        }
    }
    nix::NDSize data_shape(2, 100);

    // store data in a nix file
    nix::File f = nix::File::open("2d_multiple_regions.nix", nix::FileMode::Overwrite, "hdf5",
                                  nix::Compression::DeflateNormal);
    nix::Block b = f.createBlock("demo block", "nix.demo");

    nix::DataArray array = b.createDataArray("2d random data", "nix.sampled.2d", data);
    nix::SampledDimension dim = array.appendSampledDimension(1.);
    dim.label("width");
    dim.unit("mm");
    dim = array.appendSampledDimension(1.);
    dim.label("height");
    dim.unit("mm");

    array_type_2d pos(boost::extents[2][2]); // 2 regions, 2 dimensions
    nix::NDSize pos_shape = {2, 2};
    pos[0][0] = 10;
    pos[1][0] = 90;
    pos[0][1] = 60;
    pos[1][1] = 5;
    nix::DataArray positions = b.createDataArray("positions", "nix.positions", pos);
    positions.appendSetDimension();
    positions.appendSetDimension();

    array_type_2d ext(boost::extents[2][2]);
    nix::NDSize ext_shape = pos_shape;
    ext[0][0] = 30;
    ext[1][0] = -30;
    ext[0][1] = 30;
    ext[1][1] = 20;
    nix::DataArray extents = b.createDataArray("extents", "nix.extents", ext);
    extents.appendSetDimension();
    extents.appendSetDimension();

    // bind everything together using a MultiTag
    nix::MultiTag regions = b.createMultiTag("regions", "nix.regions.2d", positions);
    regions.extents(extents);
    regions.addReference(array);

    f.close();
    return 0;
}
This approach can be extended into n-D. The following figure illustrates the 3-D case.
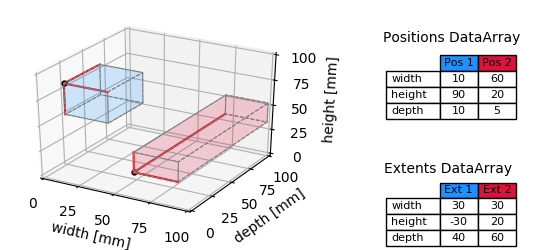
multiple_regions_3D_plot
The only things that need to be changed in the above code, are the layout of the data (now 3-dimensional) and further entries into position and extent DataArrays along the second dimension (compare tables in the figure). Again, these DataArrays are always 2D, the first dimension represents the number of tagged regions, the second the number of dimensions.